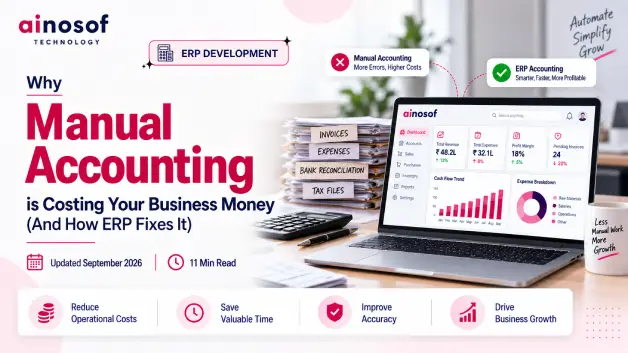
ERP vs Custom Software: Which One Does Your Business Actually Need?
 Iram
Iram


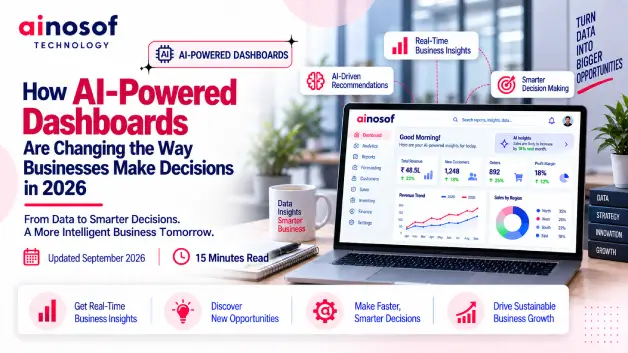
As a business grows, decision-making rarely becomes difficult because there is too little data. It becomes difficult because there is too much data, coming from too many places, without enough clarity about what actually needs attention. Sales numbers may be rising while margins are falling. Inventory may look healthy overall while a few products are creating serious cash-flow problems. Managers may receive detailed reports every day and still spend hours trying to understand what changed.
Traditional dashboards can show businesses what has already happened, but that does not always answer the questions managers need to act on: Why is this changing? What could happen next? Where is the risk? What should we investigate first?
This is where AI-powered dashboards are changing the role of business reporting. Instead of making managers search through multiple reports and manually connect patterns, intelligent dashboards can help surface trends, anomalies, relationships, and predictive signals that may otherwise be overlooked. But AI does not automatically make business decisions better. The quality of the data, the relevance of the insights, and the ability of managers to validate those insights all matter.
This article explores how AI-powered dashboards are changing business decision-making in 2026, which areas of a business can benefit most, and what companies should evaluate before investing. You will learn how to move from simply seeing business data to using it more effectively for faster, more informed, and proactive decisions.
As a company grows, its reporting needs change. A small business may be able to manage sales, inventory, expenses, and customer information through a few spreadsheets or basic dashboards. But as transactions, departments, products, customers, and locations increase, simply displaying more data does not necessarily make decision-making easier.
Traditional dashboards are still useful for tracking KPIs and understanding past performance. The problem begins when managers need to move beyond “What happened?” and answer questions such as “Why did it happen?”, “What needs attention now?”, and “What could happen next?” That gap can slow down decisions and make businesses more dependent on manual analysis.
For example, a sales dashboard may show that revenue has dropped by 12% this month. But a manager may still need to check different reports to discover whether the decline came from specific products, regions, salespeople, customer segments, or changes in buying patterns.
The business challenge is therefore not simply data visibility. It is turning that visibility into useful business understanding. As data becomes more complex, dashboards need to help managers interpret information rather than simply present it.
A dashboard can show hundreds of numbers and charts without telling a manager which ones actually matter. This creates a common problem: information is available, but business insight is still missing.
Managers may see that sales are falling, inventory is increasing, or customer orders are changing. However, understanding the reason behind those movements may require comparing several data sources manually.
For instance, suppose an ecommerce business notices that overall sales are stable. A traditional dashboard may show healthy revenue figures, but a deeper review could reveal that sales from high-margin products have declined while low-margin products are selling more. The headline number looks acceptable, but the underlying business position is becoming weaker.
This is why visibility alone is not enough. Better decision-making requires context, relationships between data points, and a clear understanding of what deserves attention.
The real value of a business dashboard should therefore be measured by how effectively it helps managers move from information to action.
As businesses grow, managers often spend a surprising amount of time preparing, comparing, and interpreting reports. Data may come from ERP systems, CRM platforms, spreadsheets, accounting software, ecommerce platforms, and other business applications.
The problem becomes worse when these systems are not properly connected. A manager may need to export sales data, compare it with inventory reports, review purchasing information, and then check financial figures before reaching a conclusion.
Imagine a purchasing manager trying to understand why inventory costs increased. Instead of receiving a clear signal, they may have to compare purchase prices, order volumes, supplier performance, stock levels, and sales demand across several reports.
This manual work does more than consume time. It can delay decisions, increase the chance of human error, and make important signals easier to overlook.
As business complexity increases, reducing the time spent interpreting routine reports becomes an important part of improving decision speed.
AI-powered dashboards are changing dashboards from systems that mainly display information into systems that can help managers analyse information and identify what deserves attention.
Instead of expecting users to find every important pattern themselves, AI can examine large amounts of business data and highlight unusual movements, relationships, trends, and potential future outcomes. This does not remove the need for human judgment. Rather, it can help managers spend less time searching through data and more time deciding what to do about it.
The difference becomes especially important when businesses handle large volumes of transactions. A human may struggle to compare thousands of records across multiple dimensions, while an AI system can analyse those relationships much faster.
For example, an AI dashboard could identify that a particular product category is experiencing declining demand in one region while demand is increasing in another. That insight could help a business adjust inventory, marketing, or sales priorities before the trend becomes a larger problem.
The shift is from reporting what happened toward helping businesses understand what is changing, why it may be changing, and what could happen next.
Businesses generate patterns every day, but not all of them are obvious. Some may appear only when different datasets are compared over time.
AI can analyse large and complex datasets to identify relationships that may be difficult to spot through routine reporting. These can include unusual sales movements, changing customer behaviour, demand patterns, recurring operational issues, or unexpected cost increases.
For example, a manager might notice that monthly sales are stable. An AI-powered dashboard could go further and identify that repeat purchases from an important customer segment have been declining for several weeks, while new-customer sales are temporarily compensating for that decline.
That difference matters because the overall revenue number may hide an emerging customer-retention problem.
AI does not make business insight valuable simply because it uses advanced technology. The value comes from connecting relevant data with a meaningful business question and presenting the result in a way managers can investigate.
When this works well, AI helps businesses notice signals earlier instead of waiting for problems to become obvious in monthly reports.
Knowing that a KPI has changed is useful, but knowing why it changed is much more valuable for decision-making.
AI dashboards can help analyse relationships between different business metrics and surface possible explanations. If profit decreases, for example, the system may help identify whether the movement is connected to lower sales, increased purchase costs, discounting, product mix, operational expenses, or another measurable factor.
Consider a manufacturing business where revenue remains stable but profit margins fall. A basic dashboard may simply show the margin decline. An AI-supported dashboard could help draw attention to rising raw-material costs combined with a shift toward lower-margin products.
This does not mean AI should automatically declare a single cause as fact. Business data can be incomplete or misleading, so managers should be able to review the underlying numbers and validate the explanation.
The strongest AI dashboards therefore combine automated analysis with transparency, helping users understand the reasoning behind an insight rather than presenting an unexplained recommendation.
Historical reports mainly tell businesses what has already happened. Predictive insights can help managers think about what may happen next.
By analysing historical patterns and current business signals, AI systems can identify potential future outcomes. Depending on the quality and availability of data, this may support areas such as sales forecasting, inventory demand, customer behaviour, cash-flow planning, and operational capacity.
For example, if demand for a particular product has followed a recurring seasonal pattern and current sales signals indicate that demand is beginning to rise, a predictive dashboard could help the business identify a potential stock requirement earlier.
This gives the purchasing team more time to review suppliers and plan orders rather than reacting after inventory becomes insufficient.
Predictive insights should still be treated as decision support, not guaranteed predictions. Unexpected market conditions, supplier issues, economic changes, or poor-quality data can affect outcomes.
The business advantage comes from getting an earlier signal that allows managers to investigate and prepare before a potential problem becomes urgent.
The value of an AI-powered dashboard becomes clearer when connected to real business decisions. The goal is not to add AI to every report. It is to identify areas where better analysis, earlier warnings, and clearer insights can improve business outcomes.
Different businesses will have different priorities. A distributor may need better inventory and purchasing decisions, while a service company may care more about sales forecasting, customer retention, and profitability.
For this reason, businesses should evaluate AI dashboards based on the decisions they need to improve rather than simply counting AI features.
For example, an organisation struggling with excess inventory may gain more value from demand forecasting and stock-risk alerts than from an advanced visual reporting feature that does not influence purchasing decisions.
The right question is not “How much AI does the dashboard have?” but “Which important business decisions can it help us make better?”
Sales teams often have access to large amounts of information, including customer history, product performance, sales pipelines, order frequency, and revenue trends. The challenge is turning this information into timely decisions.
AI-powered dashboards can help identify sales trends, unusual changes, high-value opportunities, declining customer activity, and potential revenue risks.
For example, a sales manager may see that total revenue is on target. An AI analysis could reveal that a few large customers are responsible for most of the current performance while several previously active customers are reducing their orders.
That insight can change the manager's priorities. Instead of simply celebrating the revenue number, the team may investigate customer retention and account-level risks.
AI can also help managers identify which products, regions, customer groups, or sales channels are contributing most to growth.
The result is a more focused sales decision process, where managers can spend attention on areas that are most likely to affect revenue.
Inventory and operations often involve decisions that need to be made before problems become visible in financial reports.
AI dashboards can analyse stock movement, demand patterns, purchasing history, supplier data, order frequency, and operational trends to help managers identify potential issues.
For example, if a product is selling faster than usual and current inventory levels are already declining, an AI-supported system may highlight the situation before the product reaches a critical stock level.
Similarly, if a supplier's delivery performance has gradually deteriorated, combining supplier and purchasing data may help managers identify the pattern earlier.
These insights can support decisions around reordering, supplier management, stock allocation, purchasing priorities, and operational planning.
AI does not replace the purchasing or operations manager. It can reduce the effort required to find important signals so that managers can investigate and make decisions sooner.
Not every important business signal appears as an obvious problem. Some risks develop gradually, while opportunities may exist in data that managers have not yet examined closely.
AI-powered dashboards can help surface anomalies, unusual changes, emerging trends, and relationships between business metrics.
For example, a business may discover that one customer segment has been increasing its order value consistently, creating an opportunity for a targeted sales strategy. At the same time, another segment may show declining engagement, creating a potential retention risk.
The same dashboard can therefore support both risk identification and opportunity discovery.
However, an AI-generated signal should lead to investigation, not automatic action. Managers need to understand the context and confirm whether the insight makes business sense.
The strongest use of AI is therefore not replacing management judgment, but helping managers notice the right questions earlier.
Buying an AI-powered dashboard without preparing the underlying business environment can create disappointing results. AI can analyse data quickly, but it cannot reliably fix incorrect, incomplete, disconnected, or poorly structured business data.
Businesses should therefore look beyond dashboards, charts, and AI features when evaluating a solution. The more important questions are whether the system can access the right data, whether its insights can be understood, and whether it can fit securely into the existing technology environment.
For example, a company may invest in an advanced dashboard, only to discover that sales information is stored in one system, inventory data in another, and important operational records in spreadsheets. If those sources are inconsistent, the dashboard may produce incomplete or misleading insights.
The investment decision should therefore consider data readiness, explainability, integration, security, customization, scalability, and long-term usability.
An AI dashboard should strengthen the decision-making process, not simply add another layer of technology.
Data quality is one of the most important foundations of AI-powered decision-making. If the underlying information is incorrect, duplicated, outdated, or inconsistent, the resulting insights may also be unreliable.
Businesses should examine where their data comes from and whether important systems are properly connected. This may include ERP, CRM, accounting, inventory, sales, purchasing, ecommerce, and operational systems.
Suppose customer names are recorded differently across two systems or inventory quantities are updated at different times. An AI dashboard may struggle to create a reliable picture of the business unless these data issues are addressed.
Before investing, businesses should therefore review data accuracy, completeness, consistency, update frequency, ownership, and integration.
AI becomes more useful when it is working with trustworthy business information. Without that foundation, even sophisticated analytics can produce weak decisions.
An AI dashboard should not become a black box that managers are expected to trust without question.
Managers need enough context to understand what the system has identified, which data supports the insight, and why the result may matter to the business. This is particularly important when an AI-generated recommendation could influence sales, purchasing, staffing, inventory, or financial decisions.
For example, if an AI dashboard flags a customer as a potential churn risk, the sales manager should be able to review the relevant activity and determine whether the signal makes sense.
Human validation is important because business data does not always contain the full context. A sudden decline in orders could be caused by a temporary seasonal factor rather than a long-term customer problem.
The best approach is therefore AI-assisted decision-making, where technology identifies useful signals and people provide business judgment, context, and final approval.
An AI dashboard must work within the business's existing technology environment. A visually impressive system is of limited value if it cannot reliably connect with the applications that contain important business data.
Businesses should evaluate API and system integrations, data synchronization, user permissions, security controls, customization options, reporting requirements, and scalability.
Security deserves particular attention because business dashboards may contain sensitive sales, customer, financial, employee, or operational information. Access should be controlled according to user roles, and businesses should understand how their data is stored, processed, and protected.
Customization also matters because different companies define performance differently. A manufacturing business may need production and inventory insights, while a service business may prioritise project profitability and customer performance.
Finally, the dashboard should be capable of growing with the company. More users, locations, transactions, products, and data sources should not make the system impractical.
A good AI dashboard investment is therefore not just about advanced AI capabilities. It is about building a reliable decision-support system that fits the business today and remains useful as the business grows.
AI-powered dashboards are only one part of a broader digital business improvement strategy. Once a business understands where better data and faster decisions can create value, the next step is connecting technology with the processes that drive everyday operations.
Explore relevant Ainosof resources covering ERP Software Development, Custom Software Development, Business Automation, AI Software Development, and Data Analytics to understand how different solutions can work together to improve business efficiency and decision-making.
Businesses can also explore related resources on inventory ERP, sales ERP, warehouse management, ERP reporting, and AI in business operations to build a more connected technology strategy.
The goal is not to adopt more software. It is to build the right digital systems around the decisions, processes, and growth priorities that matter most to the business.
Growing businesses cannot rely on increasingly complex reports alone. As data volumes increase, managers need faster ways to identify important changes, emerging risks, business opportunities, and potential future trends.
AI-powered dashboards can help make that shift possible by combining business data with automated analysis and predictive insights. They can support better decisions across sales, inventory, purchasing, finance, customer management, and operations.
But AI should not be treated as a replacement for business judgment. The strongest results come when businesses combine accurate data, connected systems, useful AI insights, human validation, and clear business action.
Before investing, businesses should therefore focus less on how advanced a dashboard sounds and more on whether it can solve real decision-making problems.
The future of business reporting is not simply seeing more data. It is helping the right people understand what matters and act on it at the right time.
As businesses collect more information from sales, ERP, CRM, inventory, finance, and operations, managers need more than standard reports to make timely decisions. These frequently asked questions explain how AI-powered dashboards can support business decision-making and what companies should consider before adopting them.
An AI-powered dashboard helps businesses analyse data, identify important patterns, detect unusual changes, and support faster decision-making. Instead of only showing KPIs, it can help managers understand what is changing and where attention may be needed.
For example, an AI dashboard could highlight declining sales, unusual inventory movement, or a potential change in customer demand.
The main value is helping managers move from simply viewing data to understanding and acting on it.
A traditional dashboard mainly focuses on displaying business data and KPIs. An AI-powered dashboard can go further by analysing that information and identifying patterns, anomalies, trends, or possible future outcomes.
For example, a traditional dashboard may show that sales have declined by 10%, while an AI-supported dashboard may help identify which products, regions, or customer groups contributed to the decline.
The difference is not that traditional dashboards are useless. It is that AI can add a stronger analysis and decision-support layer.
Yes, AI dashboards can support trend prediction when sufficient historical and current data is available.
They may help businesses forecast areas such as sales demand, inventory requirements, customer behaviour, or revenue patterns. However, these predictions are not guaranteed. Their usefulness depends heavily on data quality, business conditions, and the methods used by the system.
Businesses should treat predictive insights as decision-support signals, not as certain outcomes.
Yes. AI can make ERP reporting more useful for decision-making by analysing information stored across areas such as sales, purchases, inventory, finance, and operations.
Instead of manually reviewing several ERP reports, managers may receive insights about unusual transactions, changing trends, performance gaps, or potential risks.
For example, an AI dashboard connected to an ERP could identify that inventory is increasing for products where sales demand is declining, giving managers an opportunity to review purchasing decisions earlier.
AI dashboards can support decisions across several business areas, including:
The right use cases depend on the business. A manufacturing company may focus on inventory and production, while a service business may focus more on sales, customers, and profitability.
The important point is to connect AI insights with real business decisions, rather than adding AI simply because it is available.
The accuracy of AI-powered business insights depends on several factors, especially data quality, data completeness, system integration, business context, and the AI model being used.
If a business has incorrect or disconnected data, even a sophisticated AI system may produce unreliable insights.
For this reason, businesses should test AI dashboards using real business data and real decision scenarios before relying on them. Managers should also be able to review and validate important insights.
AI can improve analysis, but human judgment remains important.
No. Businesses should use AI dashboards as decision-support tools, not as complete replacements for management judgment.
AI may identify a potential risk or recommend an action based on available data, but managers understand factors that may not exist in the system, such as supplier conversations, market changes, customer relationships, or temporary business conditions.
For example, an AI system might flag a customer as a potential churn risk, but the sales manager may know that the customer has simply paused orders because of a seasonal business cycle.
The best approach is AI analysis + human validation + business action.
The cost of an AI-powered dashboard varies significantly depending on the business requirements.
Factors can include the number of data sources, integrations, users, dashboard complexity, AI capabilities, customization, security requirements, and ongoing support.
A simple dashboard connected to one data source may require far less investment than a custom AI dashboard integrated with ERP, CRM, inventory, finance, and operational systems.
Businesses should therefore evaluate the total investment and expected business value, rather than choosing a solution based only on its initial price.
Yes. AI dashboards can integrate with existing ERP software when the ERP and dashboard platform provide suitable integration methods, such as APIs, databases, connectors, or other supported data-access methods.
This can allow businesses to bring information from areas such as sales, inventory, purchasing, accounting, and operations into a central decision-support environment.
Before implementation, businesses should verify data synchronization, security, permissions, integration reliability, and whether the dashboard can access the ERP information required for its intended use.
A business should start by identifying the decisions it wants to improve, rather than starting with a list of AI features.
Evaluate whether the dashboard can:
For example, if the main problem is inventory planning, the business should test demand trends, stock alerts, and purchasing insights using real inventory data.
The right AI dashboard is the one that solves meaningful business problems and improves decisions, not simply the one with the largest number of AI features
 Why Custom Software Companies Need Strong Branding to Win Enterprise Clients
16 Oct, 2026
Why Custom Software Companies Need Strong Branding to Win Enterprise Clients
16 Oct, 2026
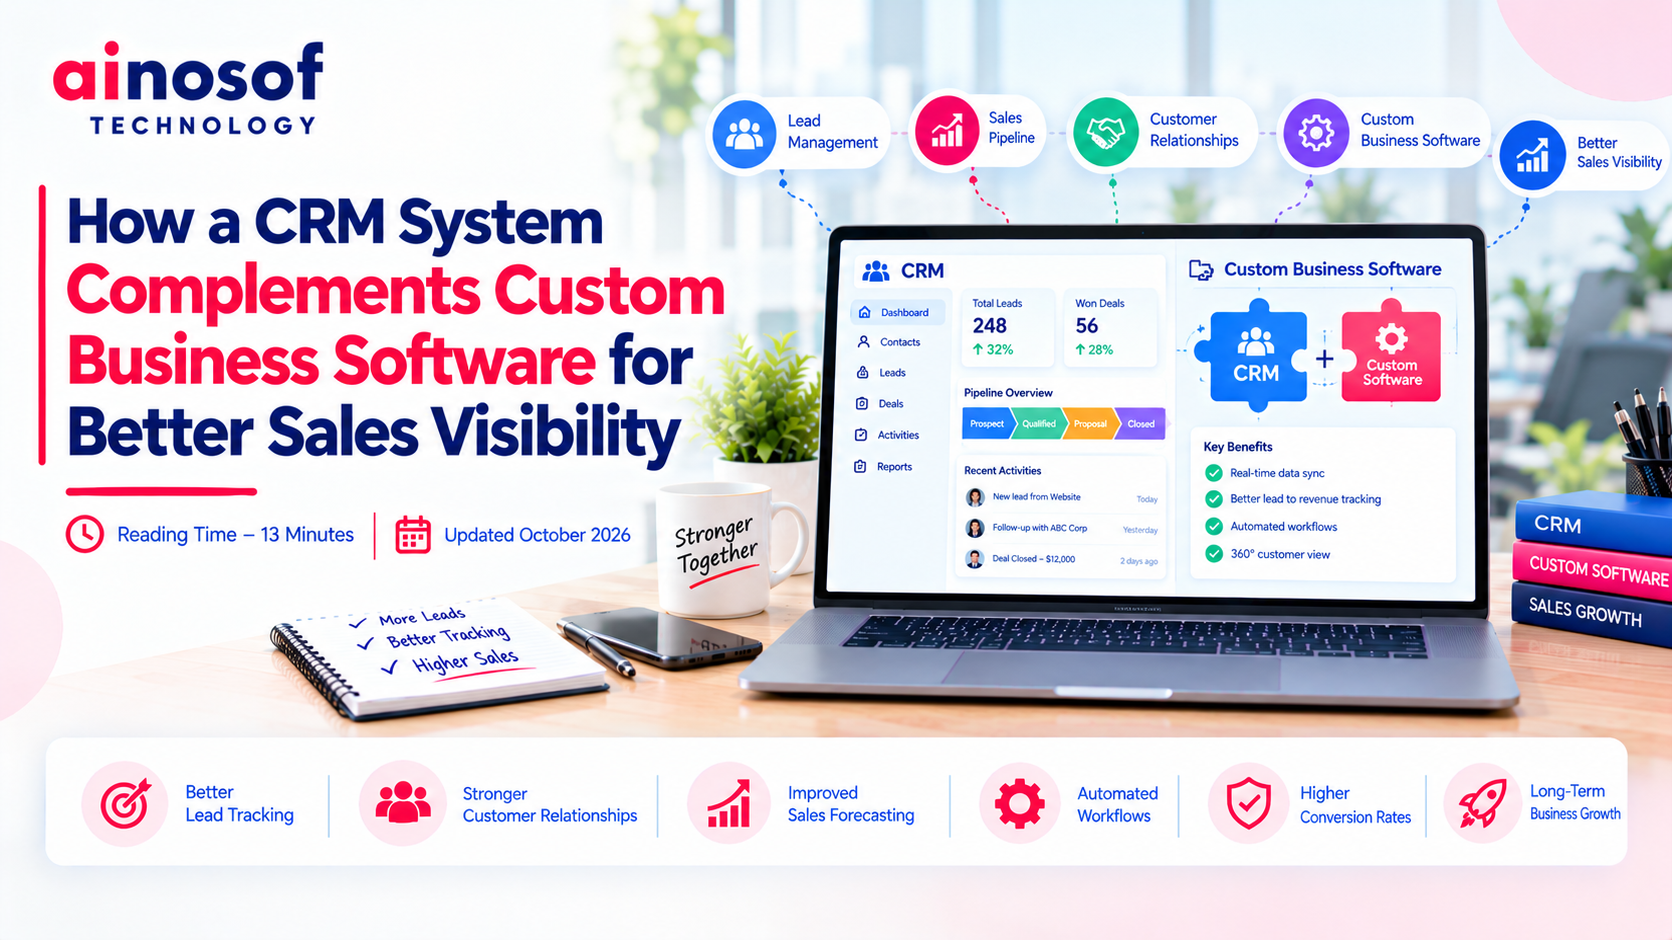 How a CRM System Complements Custom Business Software for Better Sales Visibility
15 Oct, 2026
How a CRM System Complements Custom Business Software for Better Sales Visibility
15 Oct, 2026
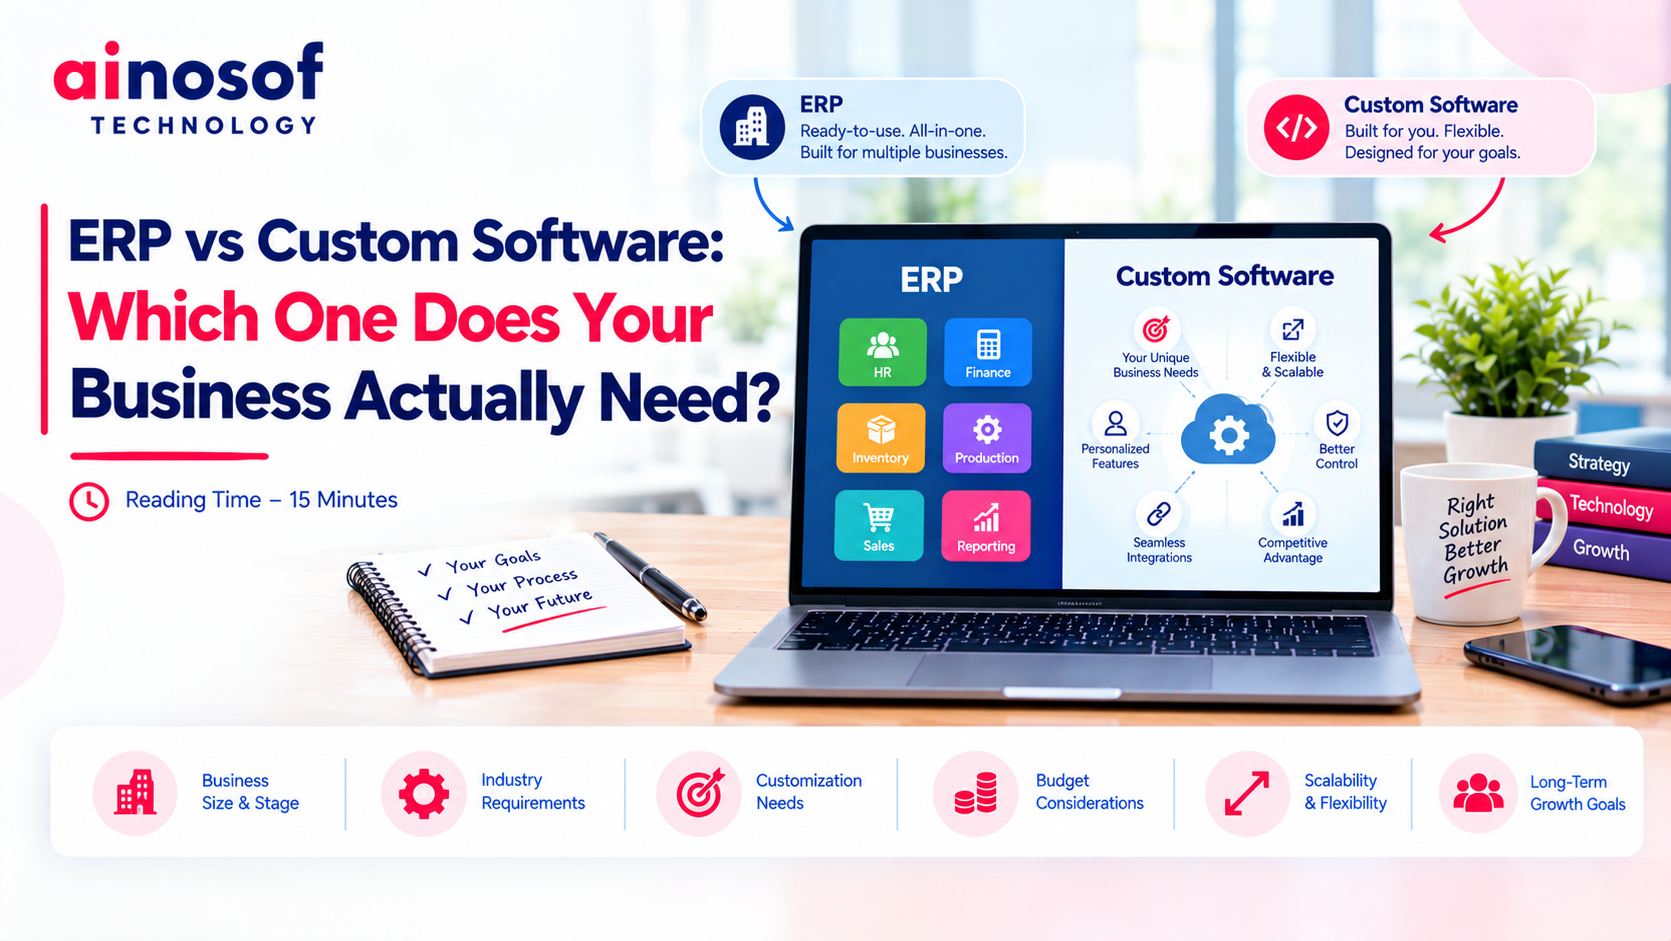 ERP vs Custom Software: Which One Does Your Business Actually Need?
14 Oct, 2026
ERP vs Custom Software: Which One Does Your Business Actually Need?
14 Oct, 2026
 How to Build an SEO Strategy for a B2B SaaS or Software Company
13 Oct, 2026
How to Build an SEO Strategy for a B2B SaaS or Software Company
13 Oct, 2026
 Why Your Business Website Should Integrate With Your Internal Software Systems
12 Oct, 2026
Why Your Business Website Should Integrate With Your Internal Software Systems
12 Oct, 2026
 How AI Agents Are Becoming Part of Custom Business Software in 2026
10 Oct, 2026
How AI Agents Are Becoming Part of Custom Business Software in 2026
10 Oct, 2026
Comment with an expert and get our answer.
Comment with an expert and get our answer.
Explore more insights related to this topic and discover useful perspectives, ideas and strategies from our latest articles.